SharePoint Analytics and Adoption? Best cram some humour in early. That way you’ll read on.
Q: What’s orange and sounds like a parrot? A: Carrot!
Speaking of orange, let me introduce you to SharePoint Vitals. The only SharePoint analytics and adoption tool we here at Britecloud work with. The question is, why?
Let me tell you
Aside from being great, quick to set up, intuitive, valuable and value for money – SharePoint Vitals has a few tricks up its sleeve that will really help your SharePoint adoption soar.
But before I get all evangelistic about Vitals, it’s worth looking at the tools available in the native products, by way of a little history lesson.
Let’s get down to it…
Usage Reports and Analytics for SharePoint On Premise – What You Get Out-of-the-Box
SharePoint 2007
Native analytics and insight reports is something that we’ve seen get less and less useful since SharePoint 2007 and SharePoint 2010 was released. Remember the good old days of WSS (Windows SharePoint Services) and MOSS (Microsoft Office SharePoint Server) usage reports that told you things like:
- Top users in the past 30 days
- Requests and queries in the past 30 days
- Top search queries in the past 30 days
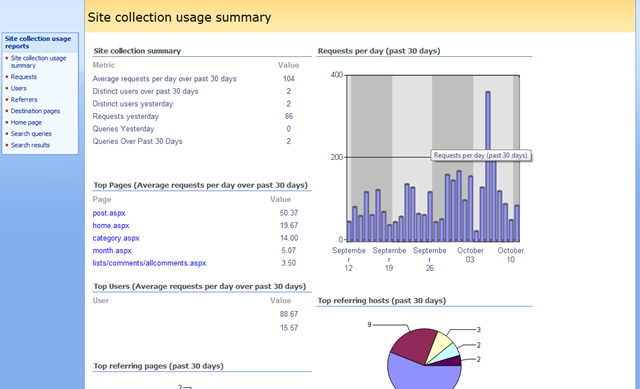
Here’s a great blog article on Technet that will remind you all about those happy times: Usage Reporting in Sharepoint, WSS or Moss
Things. Have. Changed.
Haven’t they just. From 2007 and 2010 onwards things just got worse and worse.
SharePoint 2010
Moving on to SharePoint 2010, things could actually be better than in 2007, assuming you’d set up the Web Analytics Shared Service correctly and had the SQL capacity to support the Staging and Reporting database.
As with MOSS, you had the usual suspect of reports and a few more relating to search.
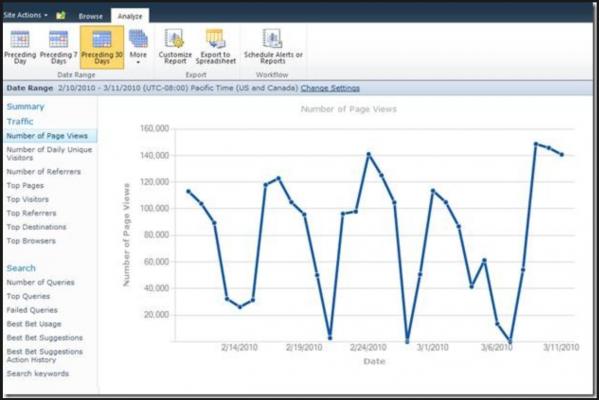
The nice thing that you got over 2007 is the date range filters on the top. SharePoint 2007 was all about last 30 days. Sometimes you want to go back a little further to see trends over time.
Web Analytics features available in SharePoint 2010:
- Reporting – showing trend, rank and list reporting for particular metrics
- Web Analytics Workflow – distribute reports on a schedule
- Web Analytics Web Part – embed quick view analytics on a site page such as Most Viewed Content
SharePoint 2013
Fast forward a few years and the release of SharePoint 2013 arrives with a fanfare, and some groans of despair as all that good work in analytics was thrown out the window.
There are plenty of analytics data points available in SharePoint 2013, which are now driven through the search services, but are they easy to consume and available in one place?
No.
Aside from the Administrative, diagnostic and health reports you have available in SharePoint Central Administration, you also get the following.
SharePoint 2013 Reports
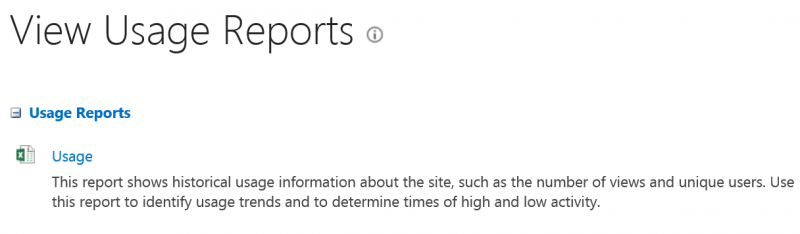
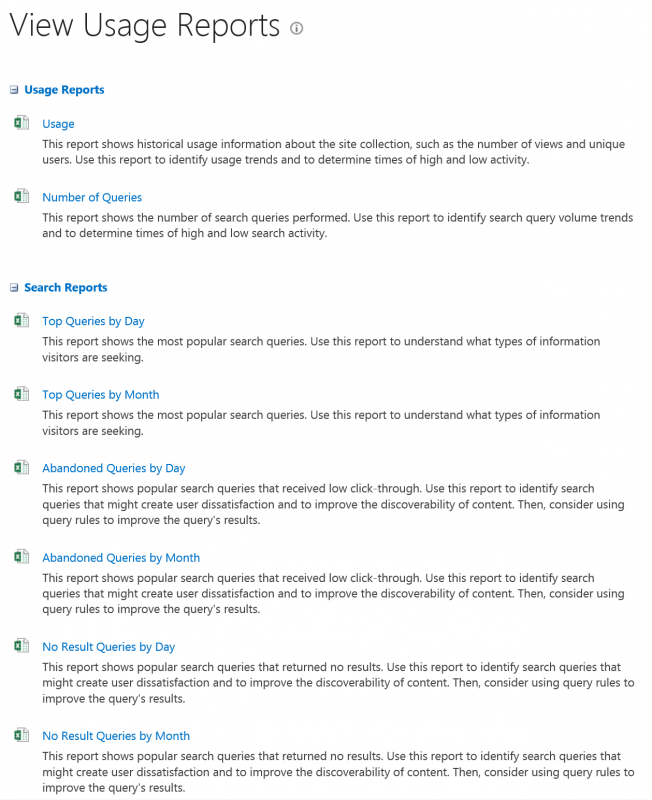
As you can see from the screenshots, for the first two options you have to download as a CSV and filter, sort and aggregate using Excel or your similar tool of choice.
If you want them aggregated and available to report on in real time you’re going to design your own ETL functionality and dashboarding. And if you want to know about most popular documents across a site collection, you’ll need to do that list and library at a time! Tough on a large and busy intranet for example.
The strangest thing about this lack of holistic reporting is that, at the same time that SharePoint 2013 released, SharePoint analytics and adoption really began to take hold as a topic of conversation in SharePoint circles.
Usage Reports and Analytics for Office 365 – What You Get Out-of-the-Box
Things get better here, as you’d hope. There are still the same old Site Collection reports of course, giving you high level insights into Usage and Search. You’ll find these in the same place that you find them in SharePoint On Premise.
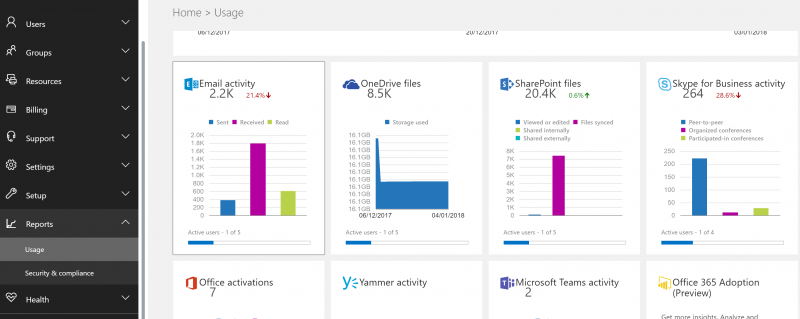
Under the Office 365 Admin Center you’ll also find usage data for the tenant as a whole. This will be interesting for global administrators and management teams wanting to find out all sorts of information like:
- Office activations
- Numbers of active users by workload
- Total number of emails sent and received
- Number of Office 365 Groups and their activity
You can filter on specific groups and users for some of the reports, and as it is unlikely that the high level graphical views will give you much insight, you can export the reports to Excel to further interrogate.
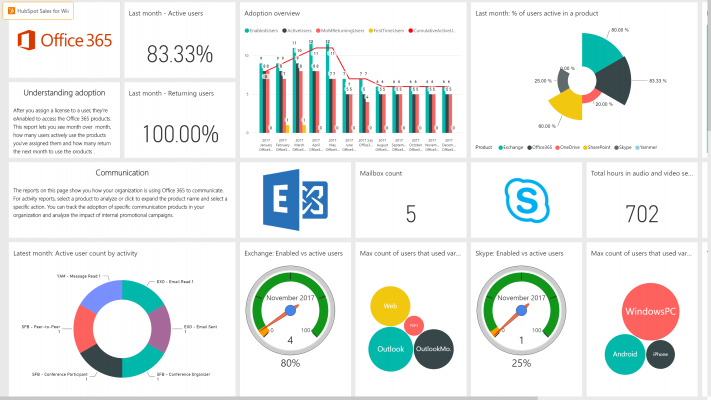
And if you want more detail on Office 365 ‘workloads’ you can also make use of the Office 365 Adoption Content Pack in PowerBI.
There’s also a ton of other data in things like the Security & Compliance Centre. Including the Audit Log Search functionality. This will let you create ’on demand’ reports that show all interactions and activities across a user or group of users. The amount of data here is overwhelming.
Here’s a view of what you can filter reports on.
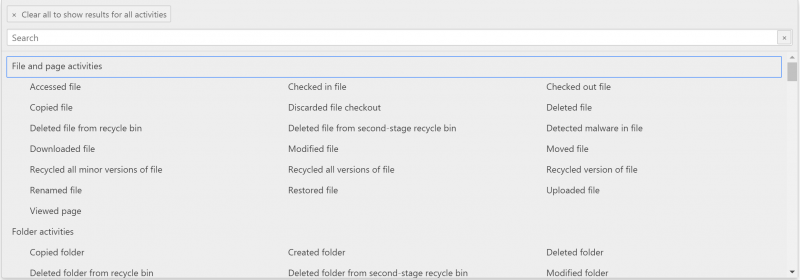
Notice the scroll bar on the right hand side.
Things just got serious!
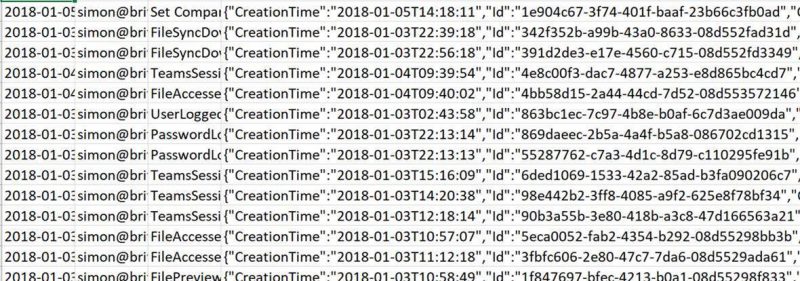
Once you’ve designed your report, simply run and wait. Depending on what you’re asking to be brought back this could take a little while.
Once you’re done, again, the only sensible way to work with the data is to download to Excel and interrogate from there. That in itself can take a while to download. My report of activity for the past couple months took about 5 minutes to download.
At that point your presented with a CSV file full of GUIDs and semi-colon delimited cells. Time to start building out your report!
So there you have it. Simple right? Well, not really.
Perhaps there is another way…
Enter Flexible and Powerful SharePoint Analytics and Adoption Reports from SharePoint Vitals
Whilst all the above reporting options can be useful in different situations, finding, collating and reporting on the data is a very manual process. SharePoint analytics and adoption shouldn’t just be easy for the end user. What about the poor soles having to collate and create these reports?
Remember that enterprise client from earlier? Despite the effort (coming at a considerable cost), they’re still not happy with results.
And this is where Vitals steps in.
Here are 10 SharePoint analytics and adoption scenarios where Vitals can help considerably:
- You want usage and adoption analytics all in one place
- You want to record usage stats for Office 365 for longer the last 3 months
- You want usage and adoption analytics in a multi-farm / multi-tenant or hybrid scenario
- You want a single view of the user (or groups) including external users
- You want to know what devices are being used across your SharePoint and Office 365 estate
- You want to know what browsers and versions are being used across your SharePoint and Office 365 estate
- You want a simple way for your IT helpdesk to troubleshoot basic user issues with SharePoint and/or Office 365
- You want empower Site and Site Collection owners with usage and adoption trend dashboards on site admin pages
- You want to create a bespoke analytics dashboard for inclusion in a business application built using SharePoint
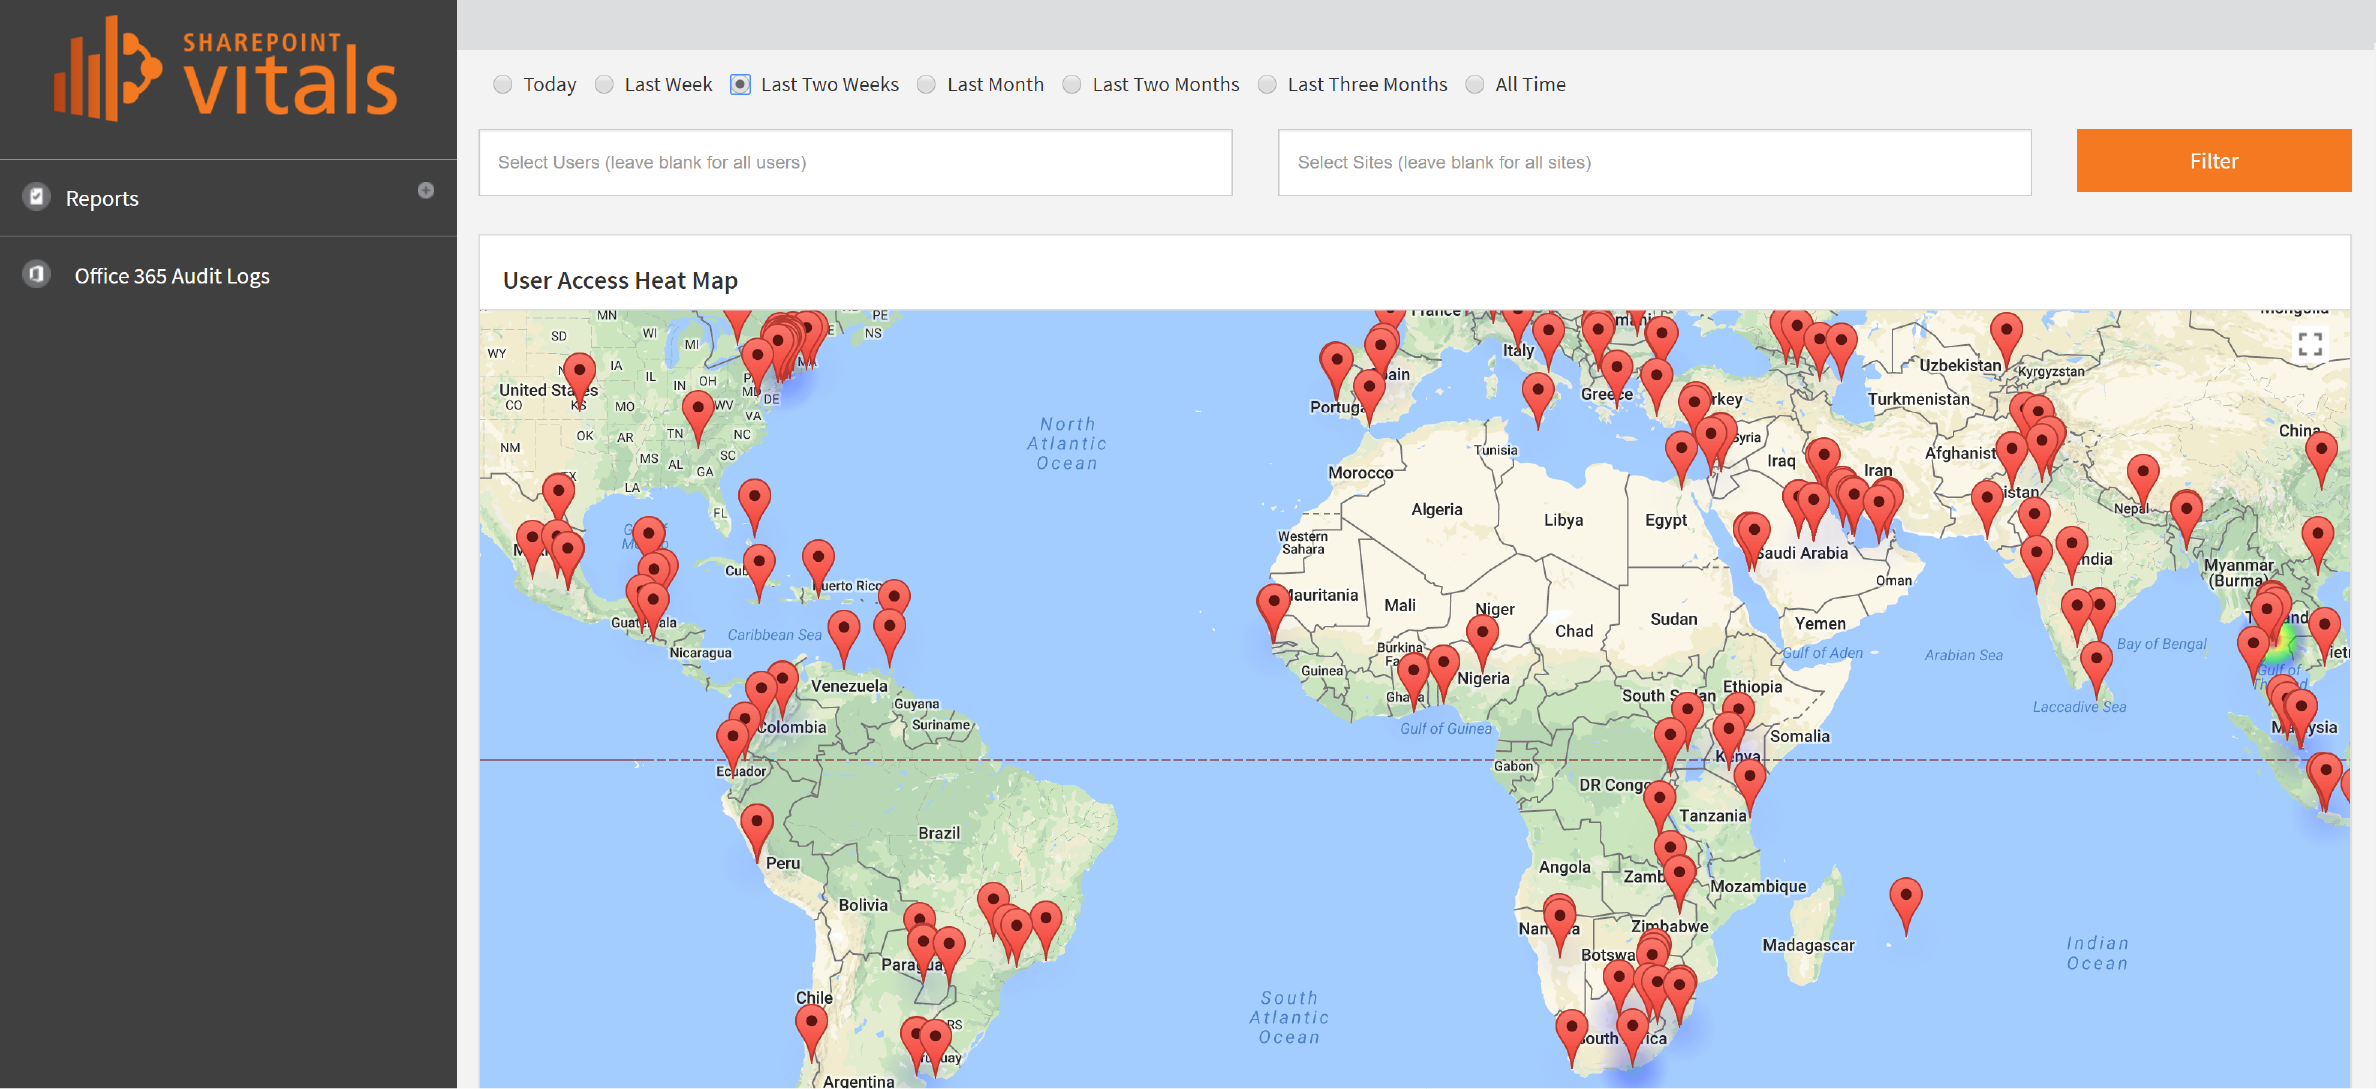
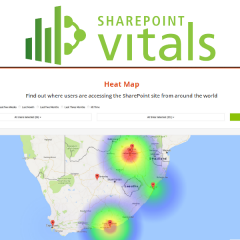
- You want to know where in the world your SharePoint or Office 365 environment is being accessed from
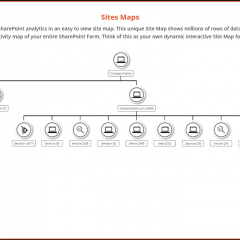
- You want a hierarchical view of all your SharePoint environments in one place
- You need to know who is watching corporate videos in Office 365 and for how long, such as onboarding or health and safety videos
- You want to know what is the most active content and most searched for terms across all your SharePoint environments
…OK, that was 13…and I could have gone on.
Some of those might seem like simple use cases, but they’re in that list for a reason. Here are a few gotchas that you might not know about:
- Office 365 audit log information is only available for a rolling 3 month period – meaning you can’t show usage or activity trends over time without creating your own application
- There is no way or reporting across multiple Office 365 tenants – not without creating your own application
- There is no unified data model for usage between SharePoint versions – back to creating an application
- Search terms, user activities, browsers and devices information are all stored in different places or reports natively – time to build that application
- Showing where in the world people are accessing your SharePoint environment isn’t possible
Some of that usage list might also have seen a little dry, but there are customer stories behind most of them.
There are many more like that.
So if all this sounds interesting, why not see it for yourself. Start a FREE TRIAL today.
START A FREE TRIAL NOW
Get a fully featured trial for 30 days. No credit card required. Be up and running in your SharePoint environment in under 10 minutes! SharePoint analytics and adoption at it’s fastest
Once the trial period is up, you can either keep all those great features by buying it, or let it downgrade automatically to the free version. It’s as simple as that.
More About SharePoint Vitals
Analytics + Reporting